Payer organizations deal with data, day in and day out. It is not enough that payers fulfill their roles in the healthcare revenue ecosystem through claim management, credentialing, code entry, billing, and so on. They need to identify their shortcomings as an organization and address them to achieve higher efficiency, and this is done with the help of descriptive analytics.
Descriptive analytics is the first step in the pipeline that allows organizations to make sense of data and take actions to improve themselves. In short, descriptive analytics describes the current standing of the payer by compiling data from its past. It is here that the data is first turned into information.
Why Payers Need Descriptive Analytics
To turn data into information, descriptive analytics use two methods – data aggregation and data mining. Data aggregation is the collection and compilation of data, while data mining looks into relations between the data sets and displays them in a comprehendible fashion. Descriptive analytics describes business insights using a range of statistical techniques to draw comparisons of various clinical, operational and financial measures.
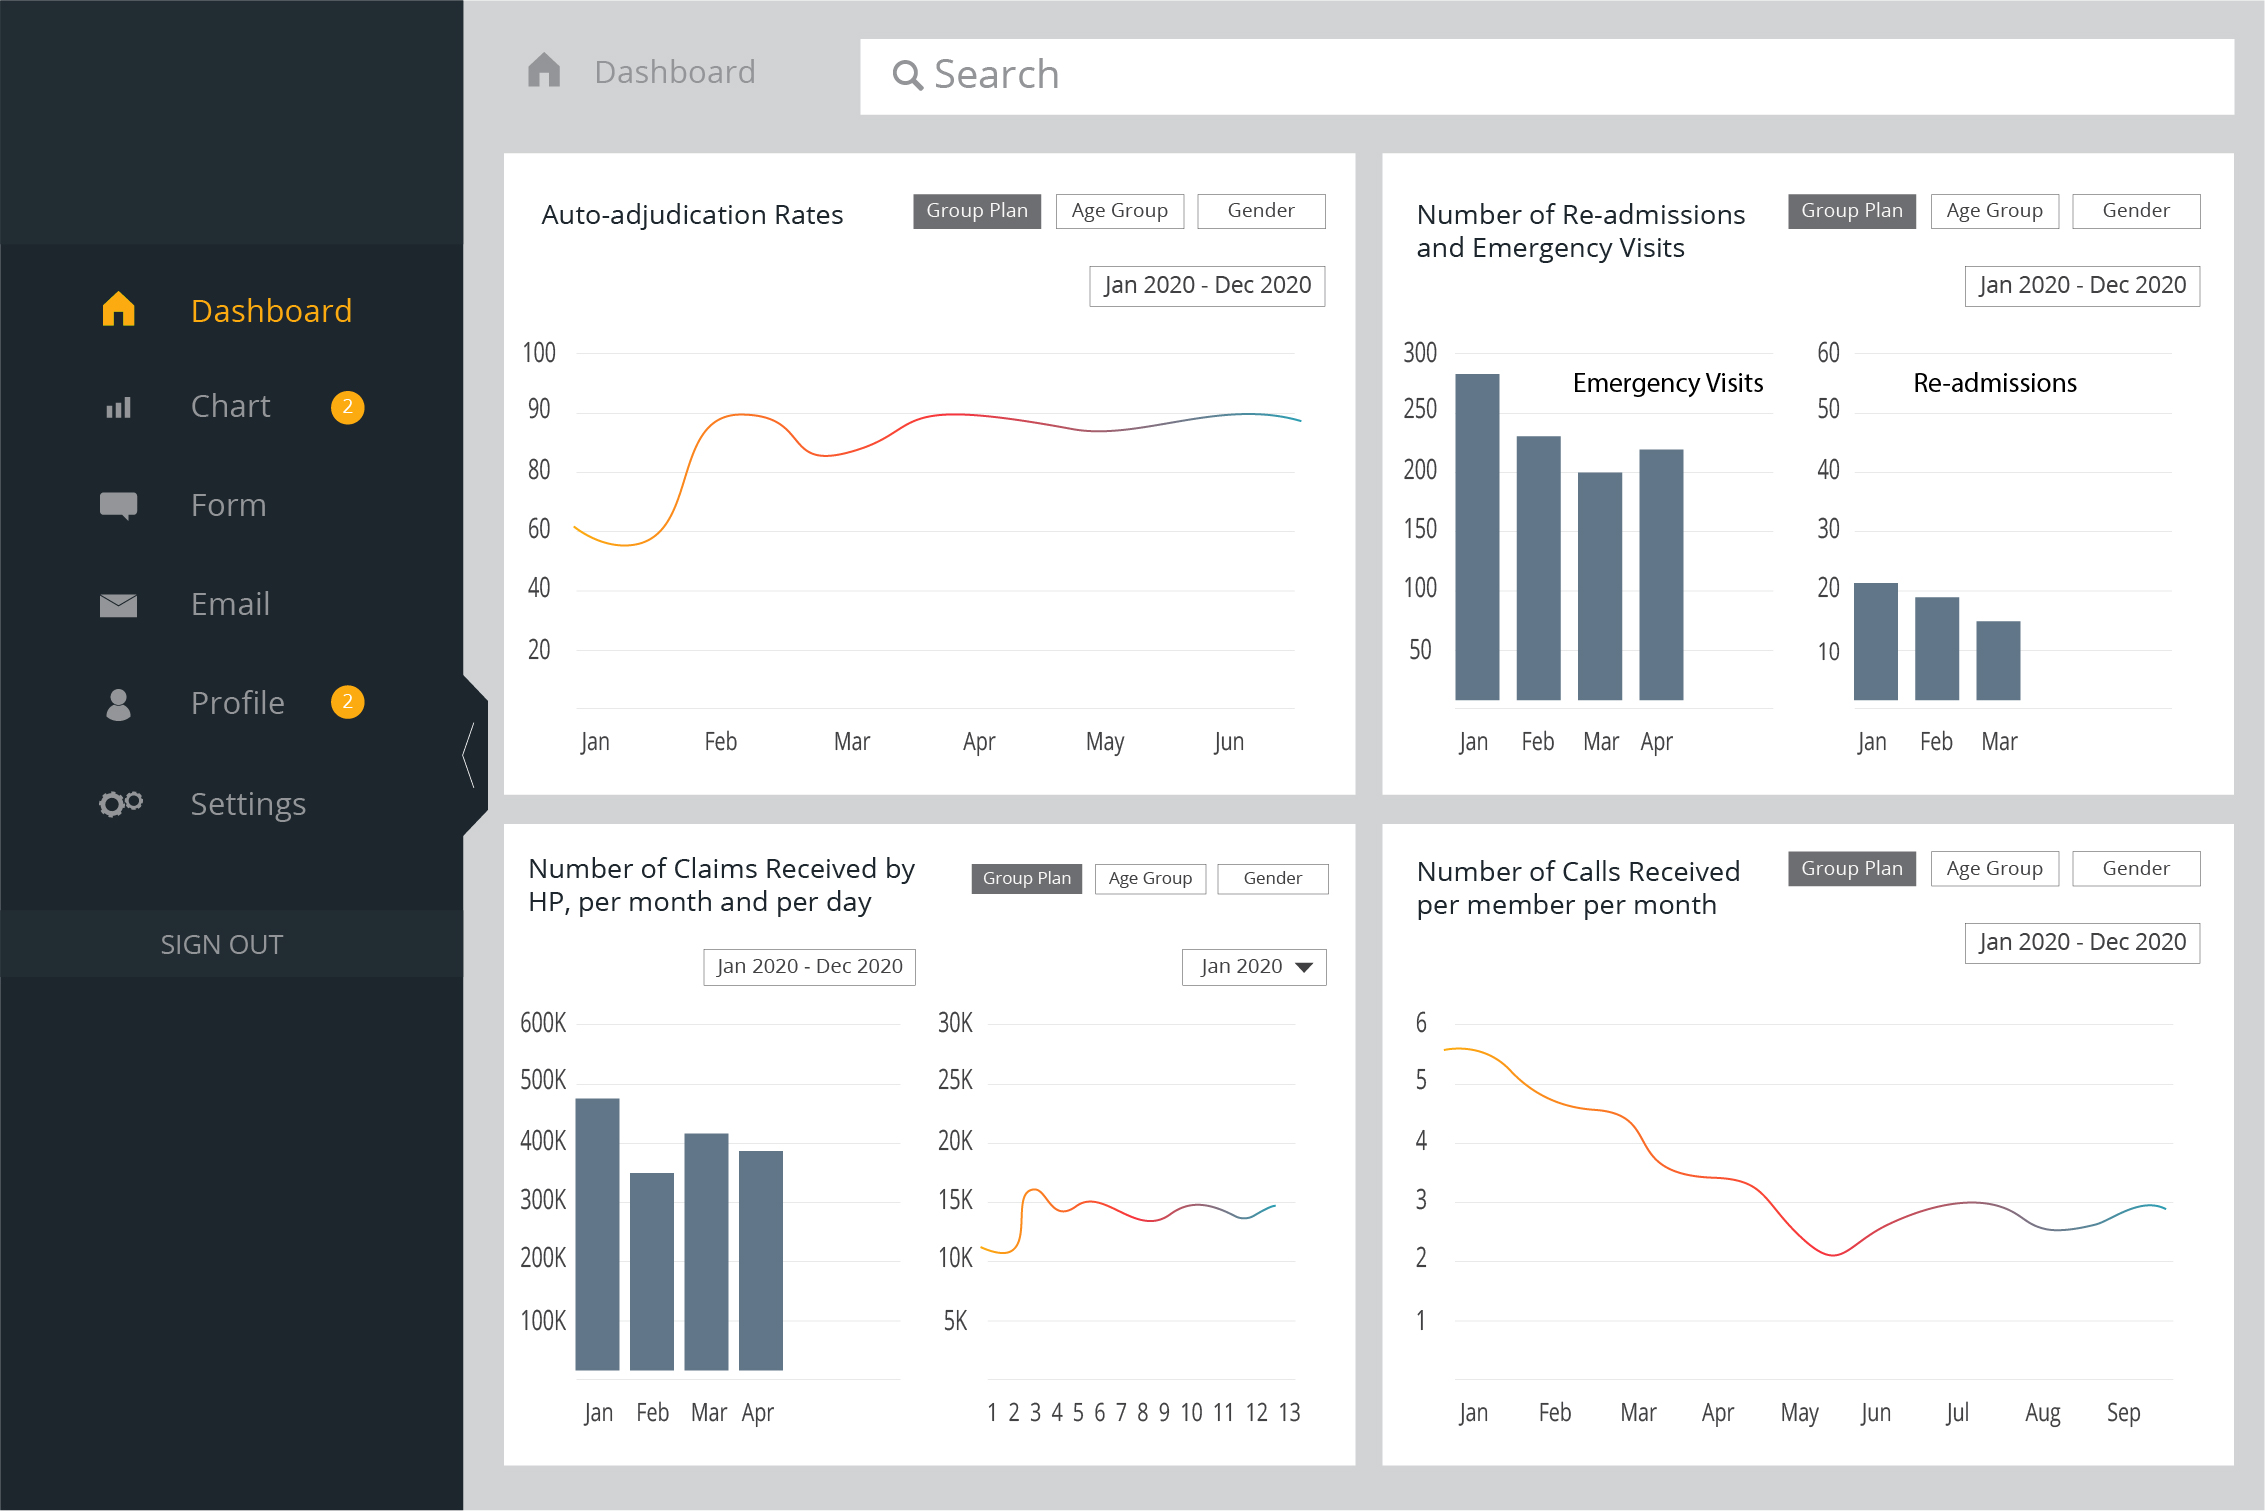
Payers must identify problems within their organizations to overcome them to attain increased efficiency. Problems can be identified by looking at trends, such as the adjudication rates, number of calls received per member in a month, re-admissions and emergency visits, and so on. Payers must also look into the number of claims received through the Health Plan in a month, to ensure enough resources are allocated to process them efficiently.
Payers also face problems when it comes to claim denials. Which denial reason is getting used highest? Which provider is billing the maximum claim amount for a certain CPT code?
Questions like the above can be easily answered with descriptive analytics, helping payers to improve their workflows and streamline processes that may otherwise come across as time-consuming.
VISUAL REPRESENTATION OF A PAYER ORGANISATION’S DASHBOARD
Conceptualize Descriptive Analytics to get Better Insights
Before collecting data for descriptive analytics, organizations lay down Key Performance Indicators (KPIs) based on the business objectives. Once the KPIs are decided, the analytics tools would aggregate and mine the data available to fill in KPI requirements to represent information in a visual format.
Descriptive analytics is an essential segment in enabling accelerated business performance. Here are a few ways descriptive analytics help businesses:
The Foundation of Analytics
- Descriptive analytics lays the foundation for all other analytics to take place in a payer organization, be it predictive or prescriptive. It aids their improvement within their internal workflows as well as within the healthcare revenue ecosystem.
- Payers gain an in-depth and holistic overview of their historical data concerning claim management, billing, credentialing, etc. It helps them understand how one set of data is related to another, allowing them to create informed strategies.
Identify Trends and Gaps
- Descriptive analytics enables payer organizations to identify trends and gaps, helping them evaluate and address the processes that need enhancement to bring in better ROI.
- With descriptive analytics, payer organizations can track manual errors by identifying gaps and offering assistance to those that need help.
Quick Assessment Reports
- Employing descriptive analytics in workflows aids in retrieving quicker assessment reports on the KPIs required. This helps payer organizations to remain up-to-date with their progress.
- Visual representation of the data aggregated and mined allows for easier sharing of assessment reports with internal and external stakeholders. It allows them to make more informed decisions in the future.
Sentiment Analysis
- One of the most powerful benefits of descriptive analytics is retrieving and analyzing data on member engagement. It helps payers adjust their member engagement approach as per the analytic findings.
- Descriptive analytics can also retrieve data on user interactions on social media platforms, enabling them to understand user sentiment. They can then work towards building better marketing strategies.
These are only a few advantages of descriptive analytics. It is not recommended to employ human effort while tackling descriptive analytics, and organizations must always rely on analytics tools to ensure error-free and clean data.
Outsource your Analytics to a Partner
As a payer organization, you already have too much on your plate to involve yourself in maneuvering through analytic tools. Hence, outsourcing your descriptive analytics requirements is the best way to ensure enhanced data collection and mining.
With in-depth knowledge of data warehousing, data governance, data mining, partner organizations can make a significant impact on the rate of improvement in claim processing, member satisfaction score, and regulatory compliances. They do so by delivering action items to decision-makers through the review of historical business trends, a subset of descriptive analytics, for starters.
However, only a partner with extensive experience in serving global clients can fulfill these business requirements. Outline the KPIs, to ensure that you get the most optimized and clean data to work with, all the while being extremely cost-efficient.
Connect with our analytics experts at info@nalashaa.com to take your payer business to new heights with extensive insights into your KPIs.